
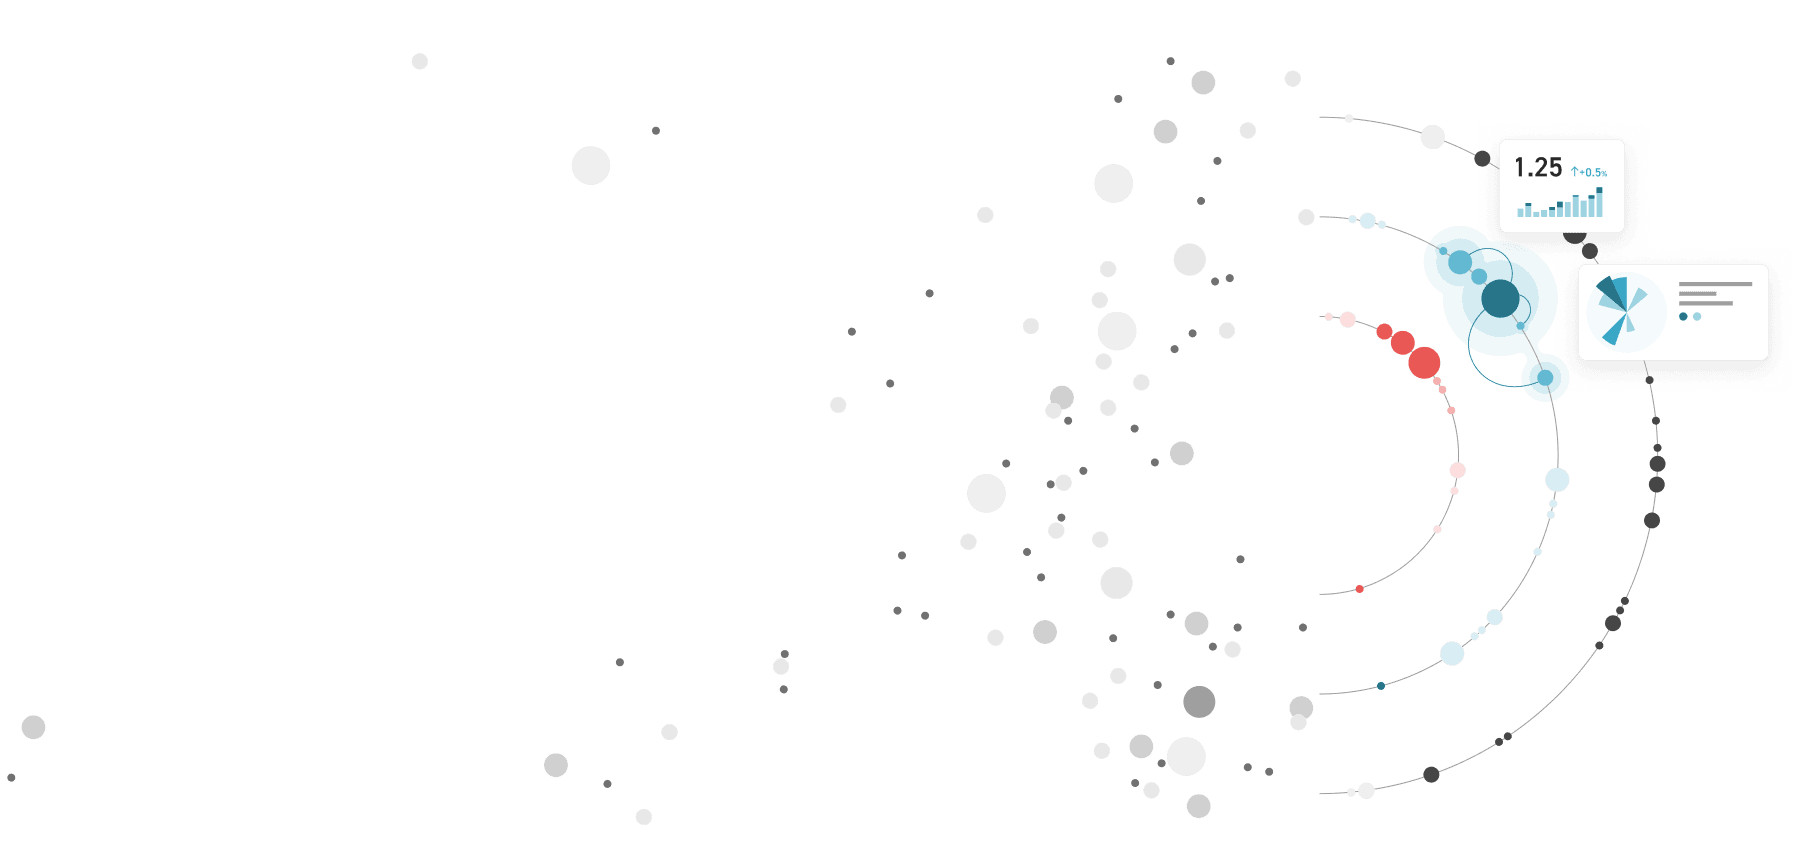







Those who understand the situation can shape what happens next.
We don't start with the data. We start by asking what people need to understand to assess their situation with confidence and take effective action.
Recommended starting point for maximum value.
ALIGN establishes the shared understanding upon which BUILD and SCALE are built.

Structuring complexity
We don’t start with the data, but with what people need to understand. Data, specialist knowledge and different perspectives are brought together to form a shared model of the relevant interrelationships.
- Analysis of the initial situation and control mechanisms
- Workshop on Identifying Gaps in Understanding
- Result: a visual model of your complex relationships

Providing Clarity
We develop a customized, visual, and interactive representation tailored to your complex situation. This allows users to explore connections on their own, shift perspectives, and pursue their own questions.
- Information, Visual, and Interaction Design
- Data Analysis, Transformation, and AI Methods
- Result: Customized interactive visualization system

Embedding Understanding
We make the visualization system an integral part of your daily work. To do this, we integrate it into existing data sources, systems, processes, and roles.
- System Integration and Data Connectivity
- Interfaces, Role and Permission Management
- Result: Onboarding and support in using the system
It starts with a conversation.
We listen, ask questions, and openly discuss whether ALIGN is the right starting point for you.
 Book a meeting
Customers and Partners



Current Research Projects
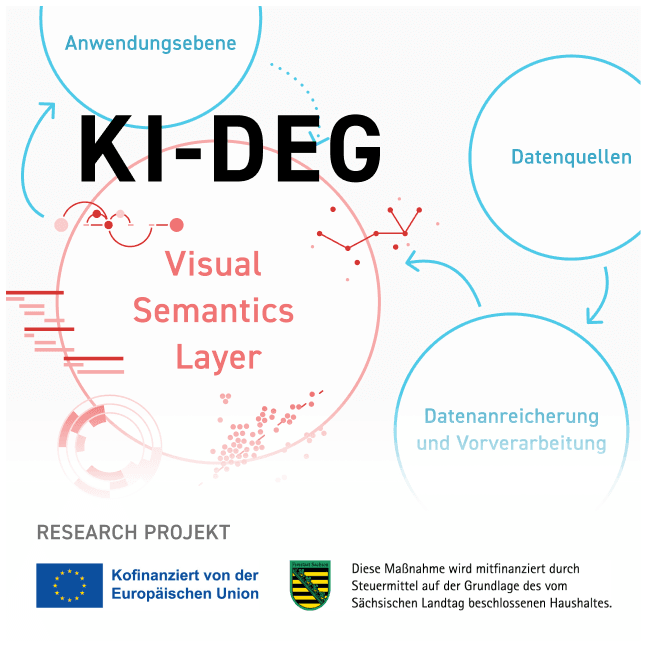
KI-DEG
AI-powered development of data visualizations to support decision-making in the manufacturing industry.
About the project »
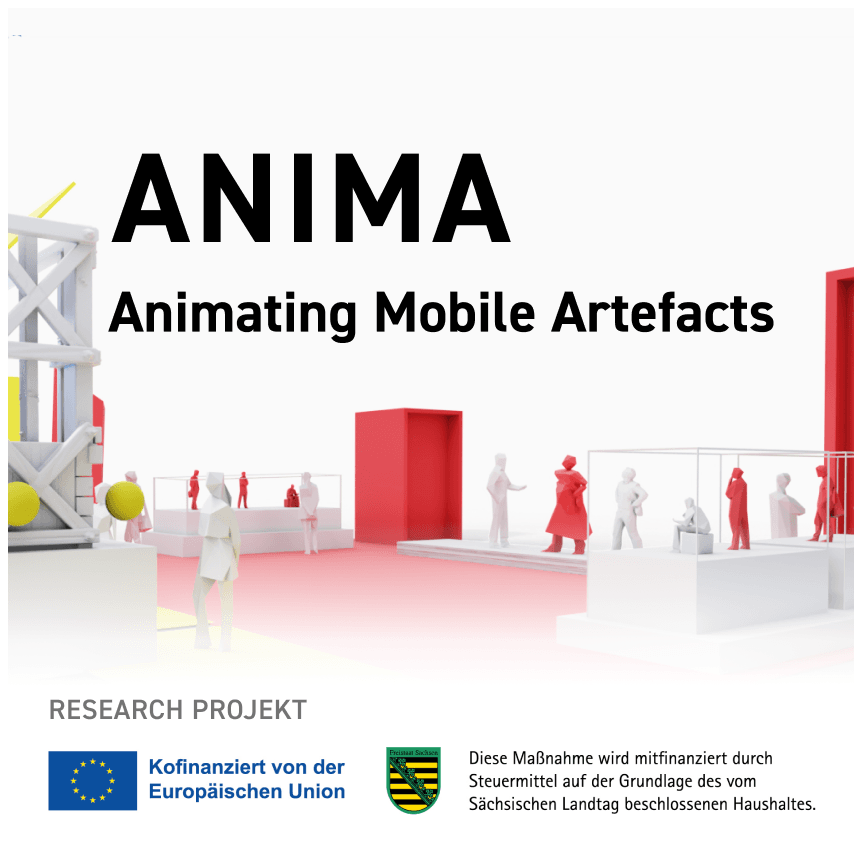
Rediscover Historical Artifacts Through Mixed Reality
We are conducting research into methods that allow people to experience formerly movable objects digitally, in order to convey their original character in innovative ways.
About the project »
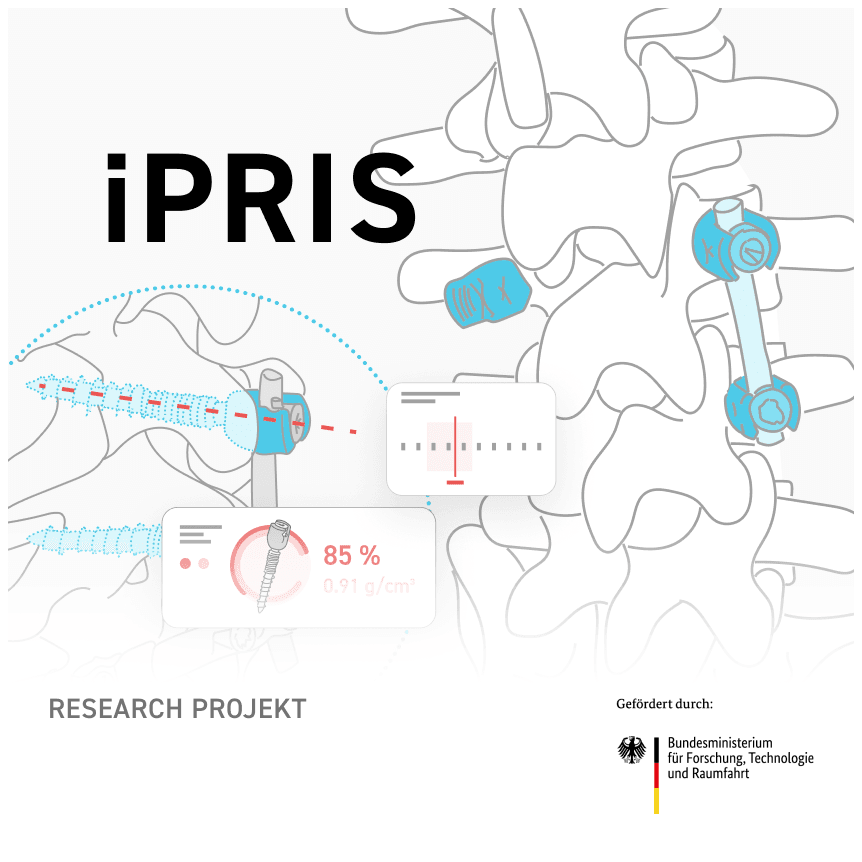
iPRIS
Instrument for the intraoperative assessment of the primary stability of pedicle screws in bone.
Go to the project »
Together, we take a closer look at your situation and bring structure to what is still unclear today.
✔ Clarity
Identify where your data doesn't yet provide a clear picture.
✔ Understanding
Recognize which connections and underlying causes need to be made more visible.
✔ Knowing what to do next
Understand which next step will make your data easier to interpret and use.


Visual Mind Team
Experts in interactive
visualization of complex
data relationships
T +49 (0) 351 275 0023-0
M info@visualistik.de